
- Knowledge Base
- Dashboard
-
Logging-in to your Transpoco account
-
How to organise your account to achieve the best results
-
How to use each feature - step by step guides
-
How to Order More Trackers
-
Live Map
-
Cameras
-
Webinar Videos
-
Walkaround Checklists
-
Reports
-
Fuel
-
Dashboard
-
Maintain Module
-
Driving Style
-
Locations
-
Cost Management (TCO) Report
-
The Notification Features
-
Hardware and Installation
-
Removal & Repair of Hardware
-
Cameras & GDPR Guidelines
-
Scheduled Reports
-
Safety Program
-
Fleet Manager App
-
Users & Permissions
-
Alerts
-
Policies & Documents
-
Privacy Policy and Terms & Conditions
-
API
-
Transpoco User Manuals
-
Settings
-
Whats New?
-
Account Mangement Services
-
Driver ID process
-
Security
-
Transpoco Locate
-
Subscriptions & Invoices
-
Tutorial videos
-
Cancelling your account
-
VOR
New Dashboard UI
We've deployed the rebuild of Dashboard UI with few new features and improvements
- Now it's possible resize and drag around the metrics (it's saved by user)
- It's also possible to refresh the metrics individually
- When creating/editing a metric now it's possible search for the groups or metrics type.
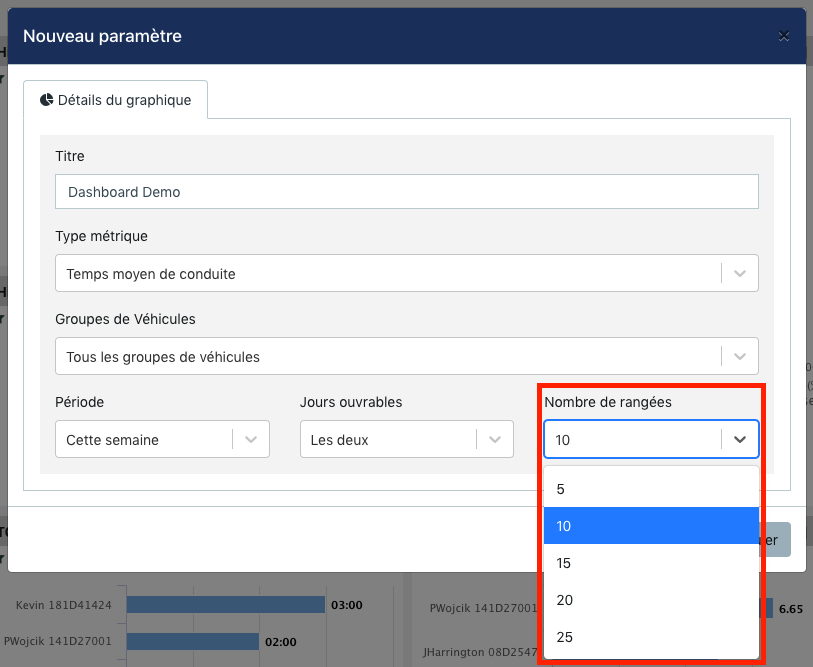
It's also part of this update a feature that allows the user select the number of vehicles to be displayed on the chart, from 5 up to 25
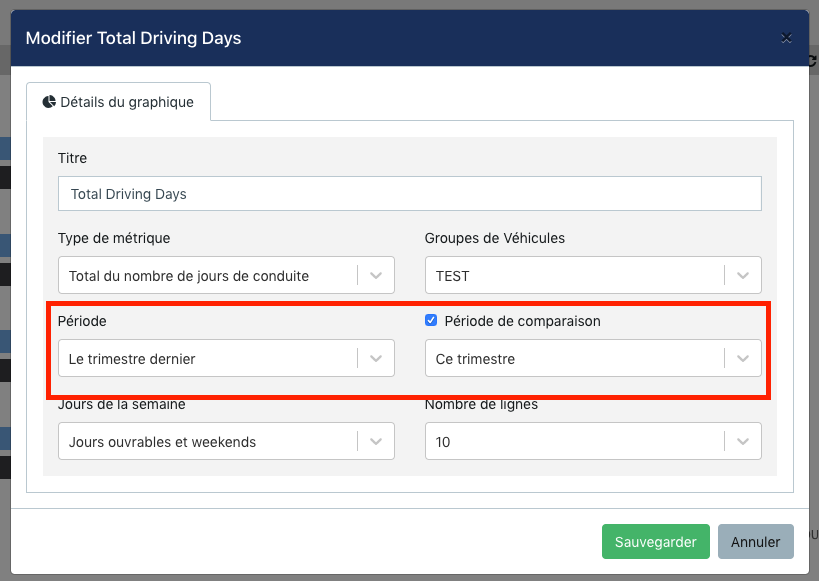
You are also able to compare two periods (eg. compare last week and this week), its enabled to all metrics except to Fuel Consumption, Speed Summary and Fleet Summary.
.gif)