The Driving Summary Report displays a graph and statistics to show the driving. It includes measurements of events; speeding, harsh braking, rapid acceleration and harsh cornering.
Before we discuss the Driving Summary report let's start by explaining how we identify events of speeding, harsh braking, rapid acceleration and harsh cornering.
Rapid AccelerationEvents are set to trigger if the next event is an increase of 21.6km/h in 1 second.
Harsh Braking
Events are set to trigger if the next event is a decrease of 21.6km/h in 1 second.
Harsh Cornering
Events are set to trigger if the next event is an increase of 21.6km/h in 1 second and a change of direction.
Speeding
Each location update from a tracker includes the speed of the vehicle. We check the speed against the speed limit of the road (Transpoco has a database of road speed limits). If the speed indicated by the tracker exceeds the road speed limit we treat this as a speeding event.
There is also a separate report for speeding - see the Speed Summary in your account.
-
Where to find the Driving Summary Report
1.Click the Services menu in the menu header.
2. Click on Driving Summary under ‘Driving Style’ in the drop-down menu.
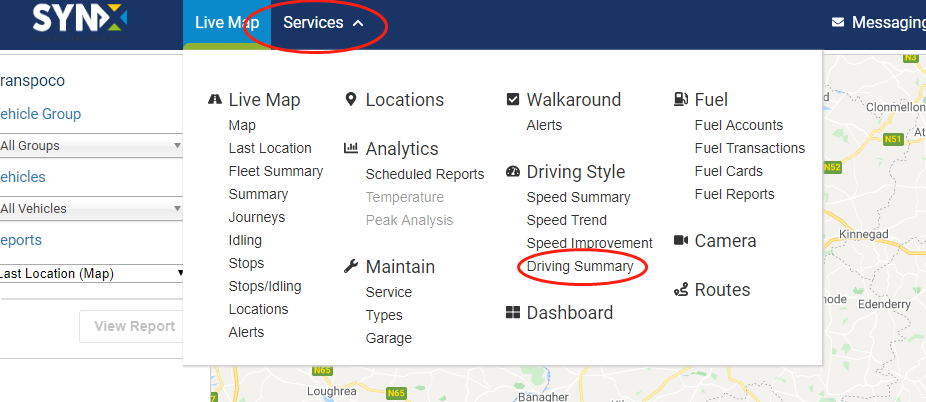
Or
From within the Driving Module, click on Driving Summary in the Driving Style menu on the left-hand side.

The Driving Summary is available for Vehicles and Drivers.
In order to show data for your drivers we will need to track the driving behaviour of your drivers. There are 2 options:
1. We can track the driving behaviour of your vehicles through a driver ID reader installed into each vehicle. Each driver will be assigned a unique key fob or RFID card and will swipe their fob/RFID over a reader located on the dashboard at the start of each journey.
2.The customer can manually assign a registration to a driver in their Driver profile. Go Settings > Garage > Drivers. It is possible you will have to create a profile for each driver. This option is ideal if your drivers drive the same vehicle each day. All journeys and events recorded during the journeys will be assigned to the driver.
-
How to read the Driving Summary Report
The tracker in a vehicle will provide a location update on average every 10-15 seconds. Each update provides a packet of information including the speed and location.
If a vehicle brakes harshly, corners harshly or accelerates rapidly this will also trigger an update from the tracker.
The Driving Summary will combine the percentage of speeding events and the unique events detected for rapid acceleration, harsh cornering and Harsh Braking.
The chart will display the data starting from worst to best and you can change the time period. To understand the data we recommend you look at the table below the chart which displays the value for each event.
For example, on the chart below TE125 has recorded a score of around 80. During this time period we only detected events for rapid acceleration and harsh cornering.
The table below the chart shows that we detected 23.88 rapid acceleration events per 100 miles and 54.28 harsh cornering events per 100 miles/Driving Summary. .png?width=688&height=332&name=Driver-Performance%20(14).png)
-Jun-07-2024-10-28-17-6692-AM.png?width=688&height=226&name=Driver-Performance%20(4)-Jun-07-2024-10-28-17-6692-AM.png)
-
View a vehicle’s speeding events
You can see details of each speeding occurrence and their locations on the map.
Click on the number in the table under speeding column.

A table of all the speeding events incurred by that vehicle/driver will open, under a map showing the location on the first speeding event.
The table includes : Vehicle, Driver, Type Description, Location, Private Mode, Value, % Over Limit, Date and Map.
To see other locations, either click on the address or the map icon at the end of the row.

Use the Google map controls to zoom into the map or see in Street View using Pegman if required.
The columns with black up/down arrows in the headers can be sorted into ascending or descending order.
Click the arrow once to sort into descending order (largest value first); click again to re-sort into ascending order (smallest value first).

To return to the main report, click on the Return to Driving Summary link above the map.

To download the report, click on the Download button on the right above the map
. 
-
View a vehicle’s harsh braking, rapid acceleration, harsh cornering events and distance driven
Note: These driving events are all similar in terms of the table information, so the following details cover harsh braking only but can be applied to all of them, apart from Distance.
Click on the number in the table under these three columns.

All detailed information in these tables remains the same as in the speeding event column which includes: Vehicle, Driver, Type Description, Location, Private Mode, Value, % Over Limit, Date and Map.
Note: The only different is that Road speed, Value and % Over limit have no value in harsh braking, rapid acceleration and harsh cornering events.

Other functions remain the same as in the speeding event column.
-
The Driving Score
The score starts at 100% and is reduced based on the events detected for Speeding, Harsh Braking, Rapid Acceleration and Harsh Cornering.

-
View all of a vehicle’s driving events with the location on map
To see details of all occurrences of all the driving events and their locations on the map, click on the vehicle name in the table.
Every detailed information and functions remain the same as above.

-
How to re-order the data in the Driving Summary
The results are show in descending order (default), which is worst to best.
1. To change to ascending order (best to worst), click on Descending.
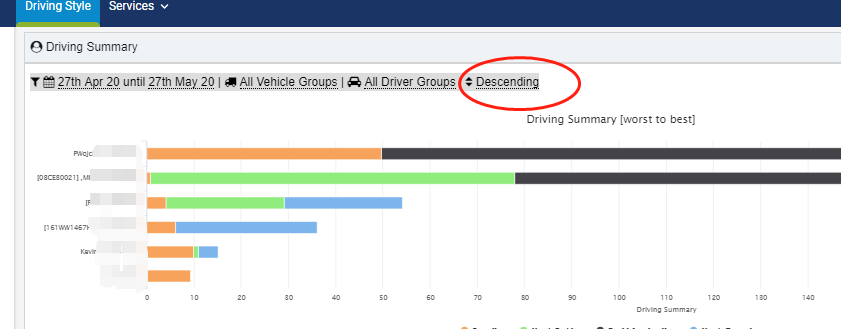
2. The filter options panel will open.
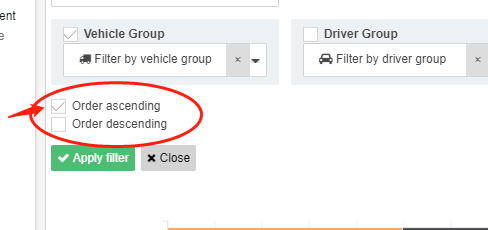
2. Click on Order ascending.
3. Click on Apply Filter. 
The graph and table will now rank the drivers from best to worst.
-
Change the date range
You can select your own dates or select one of the preset date ranges.
1. Click on the dates above the chart.
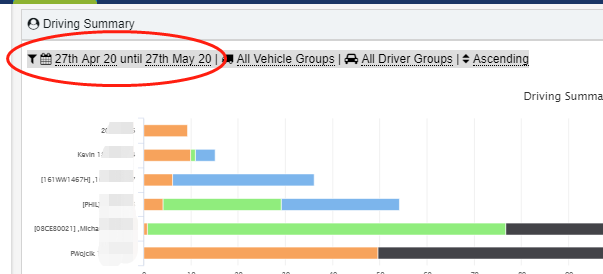
2. The filter options panel will open.
3. Click on the first date or the calendar icon to open the calendar and change the start of the required period.
The calendar will open and the first date will be underlined in green so you know you are changing the start date.
Note: the current selected period is in green, with the start and end dates in darker green.
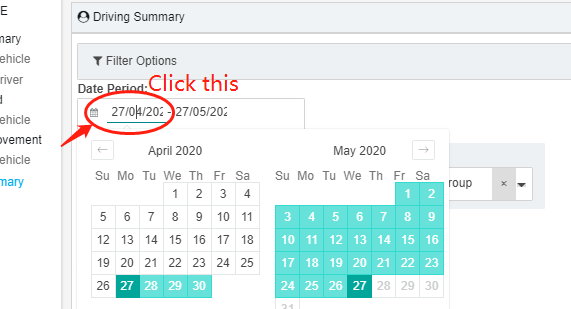
4. To choose your own dates, click on the required start date and the calendar will close.
Note: click on the previous and next arrows to view earlier or later months.
5. Click on the second date to set the end of the required period.
The calendar will open again and the second date will be underlined in green so you know you are changing the end date.
6. Click on the required end date and the calendar will close.
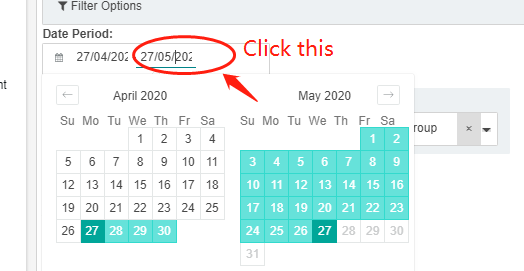
Alternatively, you can click on one of the set periods at the bottom of the calendar pop-up. This will automatically populate the date range.

-
Filter by vehicle or driver group
The default is to show all vehicle and driver groups, but you can filter the results to just show a single vehicle group or driver group.
1.Click on either All Vehicle Groups or All Driver Groups.
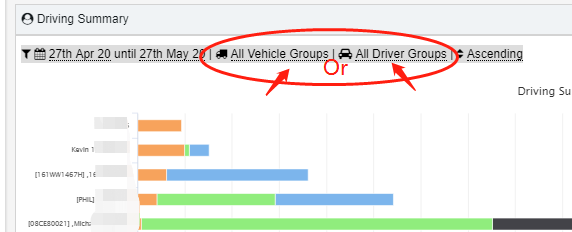
2. The filter options panel will open.
3. Click on the required group from the drop-down list.
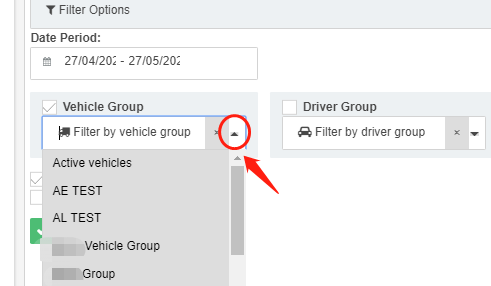
4. Click on Apply Filter. 
5. If you wish to remove the group from the filter so all vehicles or drivers will be included, click on the small x next to the drop-down arrow.
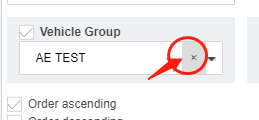
6. Click on Apply Filter. 
-
Filter Driving Events
Click on the events under the graph to either show or hide the particular event.


-
View camera events/alerts together with the other events (only if you have our camera solution)
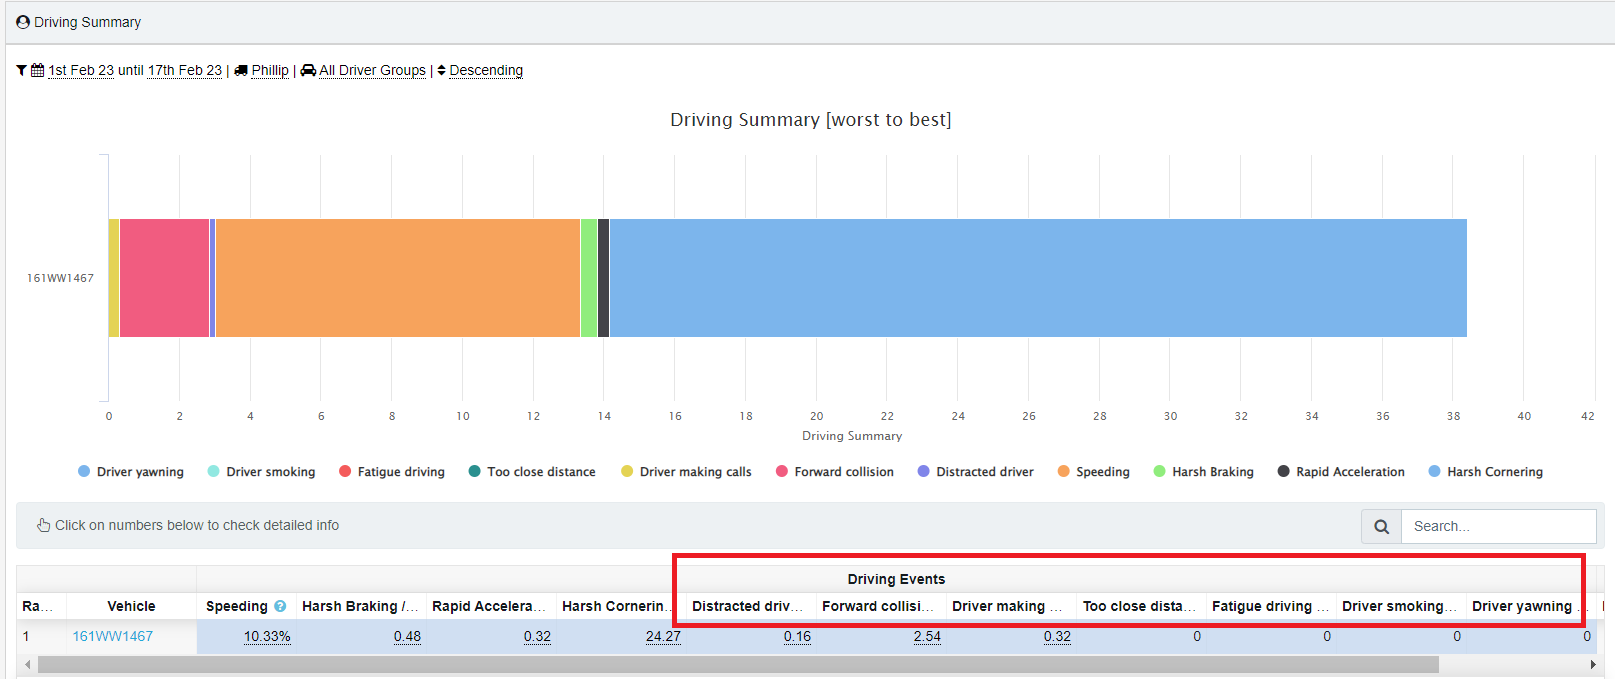
If you have our camera solution, you can select the camera events/alerts to be part of the Driving Score calculation. You will be able to see the number of events per 100km as you can see for Harsh Braking, Cornering and Acceleration.
-
Driving Summary Settings
In the Settings page, you can choose the driving events to include and assign weightings to them, depending on the importance you place on them.
In the Driving Style menu on the left-hand side, click on Settings.

- After you are ready, Click on Apply Changes.

