- Knowledge Base
- Dashboard
-
Logging-in to your Transpoco account
-
How to organise your account to achieve the best results
-
How to use each feature - step by step guides
-
How to Order More Trackers
-
Live Map
-
Cameras
-
Webinar Videos
-
Walkaround Checklists
-
Reports
-
Fuel
-
Dashboard
-
Maintain Module
-
Driving Style
-
Locations
-
Cost Management (TCO) Report
-
The Notification Features
-
Hardware and Installation
-
Removal & Repair of Hardware
-
Cameras & GDPR Guidelines
-
Scheduled Reports
-
Safety Program
-
Fleet Manager App
-
Users & Permissions
-
Alerts
-
Policies & Documents
-
Privacy Policy and Terms & Conditions
-
API
-
Transpoco User Manuals
-
Settings
-
Whats New?
-
Account Mangement Services
-
Driver ID process
-
Security
-
Transpoco Locate
-
Subscriptions & Invoices
-
Tutorial videos
-
Cancelling your account
-
VOR
How do I show/hide graph data in the Dashboard metrics?
How to hide data in the graphs if required.
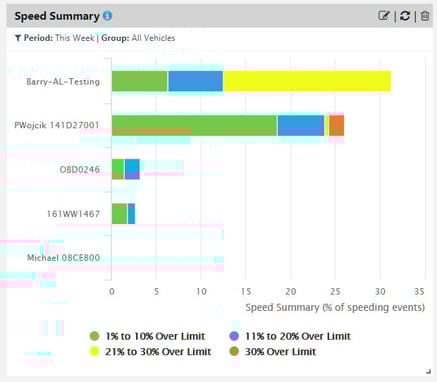
The default is to show all ranges of data in a graph, but data can be hidden if required. An example of this can be seen in the Speed Summary, which includes four ranges of data.

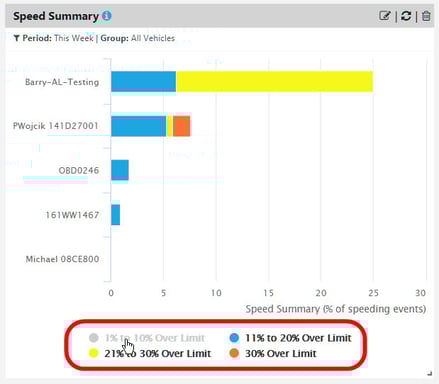
To hide a data range in the graphic, click on the relevant legend.

Click on the legend again to add the data back into the graph.
